
Auction Action is back!
Apologies for the dead air but all Glass Pyramid operatives have been busy storing acorns for winter and throwing beer cans at the TV in unsuccessful attempts to scare away the politicians filling up the horror movie that is the 6.00 o’clock news during the election campaign.
Hopefully the gaps in the data line can be plugged by idle operatives while they celebrate the special Australian birthday of our Australian Queen with some home made fireworks consisting of various combinations of flammable liquids and an inventive use of a second hand Soda Stream filler acquired at a garage sale.
UPDATED
The gaps in the data line have been updated and the comparison for this week has been stretched back 6 years to 2011. Keep in mind that the comparison is by date and not all of those earlier years were long weekends.
This makes it much easier to spot just when the RBA and APRA started to spray the housing market with cheap credit and allow the banks to support their mortgage operations with large globs of unproductive inflows of ZIRP/NIRP capital. The graph below shows how external liabilities took off (after flattening out post GFC) in 2013 as the housing bubble surged to new heights.

The picture below extracted from Table 1 has the median and estimated agents commissions highlighted in red boxes. Not hard to idenitfy a couple of groups who have benefited greatly from the surge in taxpayer guaranteed foreign debt since 2013 – existing asset owners and real estate agents
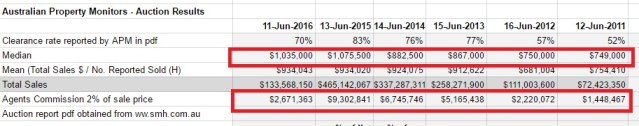
The Sydney Morning Herald and Australian Property Monitors report indicates that agents reported only 71% of the 284 auctions listed for Saturday – which is below average but is understandable as they may overlooked this task as they rushed for flights to property sales seminars in the Greek Islands over the long weekend.
Core Logic managed to round up 79% of results – probably because more auctions were scheduled for the middle of the week before the long slumber of a long weekend
In summary – a long weekend of auction inaction.
- A scrawny number of auctions this week (APM counted 284 and Core Logic 427)
- Clearance rates of 44% or 60% of scheduled auctions (70% or 76% of reported) APM v Core Logic.
- A median of $1,035,000
- A mean of $934,034 (OMG back under $1M – the RBA will be chopping again soon)
- Hammer Time – slid back below average to 26%
- Agents commissions on the sales estimated at about $2.6M on sales of approx $133M.

Note: In order to encourage agents to help APM collate the most complete stats each Saturday night, the Glass Pyramid is presenting all results as a percentage of the number of Auctions Listed. The reason for this is that agents are more likely to report ‘good results’ sooner and that can tilt the figures when results are presented as a % of what agents have bothered to report on Saturday afternoon.
Each week Realestate.com.au publishes auctions results (click here) compiled by the good folk at Core Logic RP . The difference between these results and the SMH/APM results usually arises because they include all auctions during the week, whereas the SMH/APM results are for auctions listed just on the Saturday. This means that the realestate.com.au number of scheduled auctions is usually higher.
Click on the link to read all the details in their natural habitat but the key “Auction Action” metrics are:
- No of Auctions: 427 versus 284 on SMH/APM
- % of results reported: 79% (337 of 427)
- Number cleared: 257
- Clearance as % of rep: 76%
- Clearance as % of sched: 60%
- Pre-Action Panic: 13% (57) of the sched auctions
- Hammer Time: 50% (212) of the sched auctions
- Seller Sadness: 16% (68) of the sched auctions
- The metrics are reasonably consistent with the SMP/APM results having regard to the differences in reporting rates. The higher clearance rate reports by Core Logic probably means that more of the mid-week auctions were successful.
- The reporting rates for the Core Logic rates varies a lot each week and that affects the figures when expressed as a % of the scheduled number of auctions.
Anyhow – onto the good stuff!
There are THREE tables this week. The first contains yesterday’s APM’s results pdf sliced and diced. The second contains a summary of recent weeks and the third contains the data and averages for the first 13 weeks of Auction Action fun.
Table 1 – Saturday 11 June 2016

Table 2 – Summary of recent results.
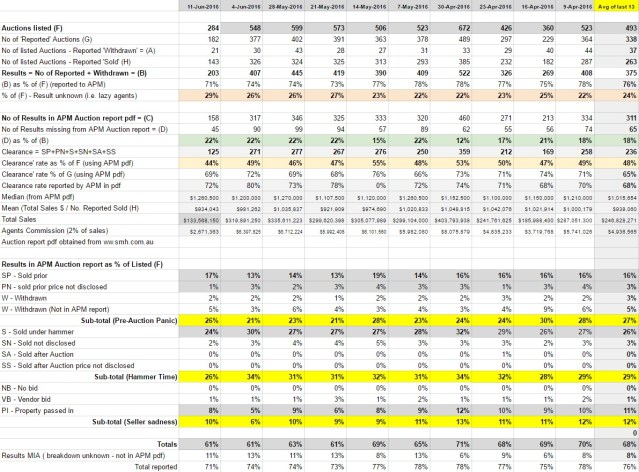
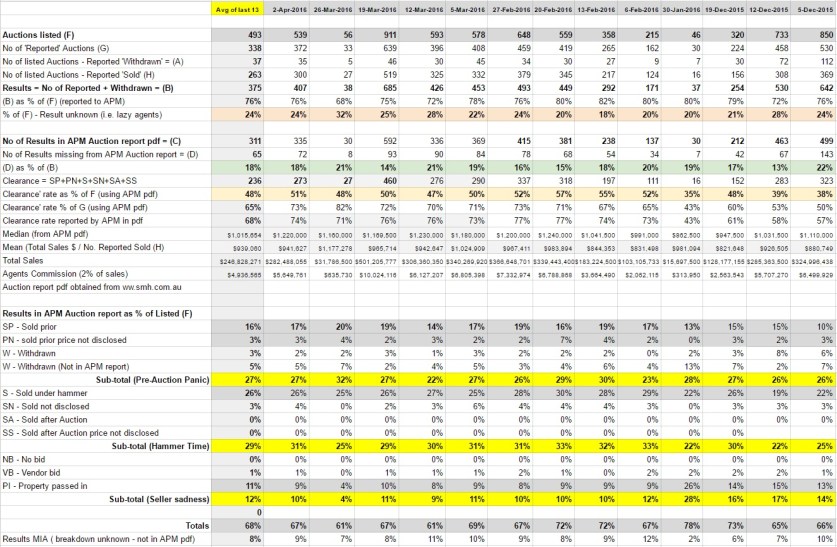
Table – Summary of the first 13 weeks of Auction Action
Categories: Macrobusiness

Recent Comments