
It was a day of sun and shadows in Sydney this week. Bursts of sunshine, miserable drizzle and then some late heavy showers. Not the kind of weather to shake off the gloom generated by bankers doing little more than creating credit for housing with a modicum of self control and responsibility. “Hammer Time” this week was a woeful 14% with “Pre-action Panic” (selling before auction and withdrawing a listed property from auction) cracking 30%.
Once again this week the newspapers and TV were full of panic and a multitude of horror stories about how the prices of some Sydney houses and apartments were now ‘lower’ than they were during the full bubble frenzy of the last few years.
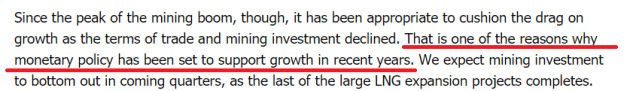
On the bright side, few people (apart from the usual suspects) remain confused as to what is going on. The hearings of the Royal Commission (and the RBA see below) and evidence received have explained that the rise in housing prices in Sydney and Melbourne over the last 6 years was little more than deliberate bubble blowing by the ‘independent’ regulators (RBA and APRA) with the enthusiastic participation of the private banks and people like Scott Morrison applauding all the way.
Though to understand the RBA role in blowing the bubble you have to translate a bit, as “support growth” is the standard RBA euphemism for pushing down interest rates and allowing a torrent of credit to be sprayed at residential housing asset prices by the banking system.
Basically the RBA thought the mining boom would run for 30 years and when it did not they panicked and decided to create a housing bubble instead. Lazy and careless but that is what happens when detached regulators decide to run an economy with one big lever. Watch out little people!
So cooling the Sydney housing market has taken little more than having the Royal Commission jump up and down a bit, be scary, do what APRA would not, wave a big stick at the bankers and require that they resort to verified data rather than apply delusional assumptions about the expense patterns of the average household when they were handing out super cheap credit facilitated by the RBA.
Naturally, more than a few people are wondering what were our regulatory superstars at the RBA and APRA thinking when they threw a large tin of kerosene on the Sydney and Melbourne property market in 2012/2013. Especially after the Sydney market had largely stabilised and become nice and boring after the stresses of the GFC. Why, after a dodging a bullet in the GFC, did they work so hard to ensure that Sydney and Melbourne property markets were running as hot as possible?
Housing market bubbles are not the sort of growth anyone with an ounce of common sense should be encouraging with banking system credit creation. Real investment that expands the productive capacity of the economy is what should have been encouraged. Instead we shut those parts of the economy down as fast as possible as asset price speculation become the only show in town. Note: The proposed changes to CGT discounts by the ALP to encourage new housing construction and to limit tax incentives for speculation in existing property prices are a long overdue step in the right direction.
Was it just laziness and carelessness or something else?
We will never really know as our ‘regulators’ are not very self-aware and certainly don’t admit their failures to the ‘little people’. One need only re-read speeches of Luci Ellis (RBA Watch: Luci and the Platypus) to see that full bubble denial was standard operating procedure as recently as February 2017
So on to this week’s Auction Action stats.
Table 1: Hammer Time
Table 1 shows the totals for each category in the APM pdf reported by Domain. Hammer time is the percentage of the listed auctions that were sold under hammer or shortly afterwards. This week “Hammer Time” was a soggy 14% of listed auctions. Far from the endless sun of recent years when the banks were pumping credit into speculators wallets, APRA was snoring under the willows and Hammer Time was often over 30%.

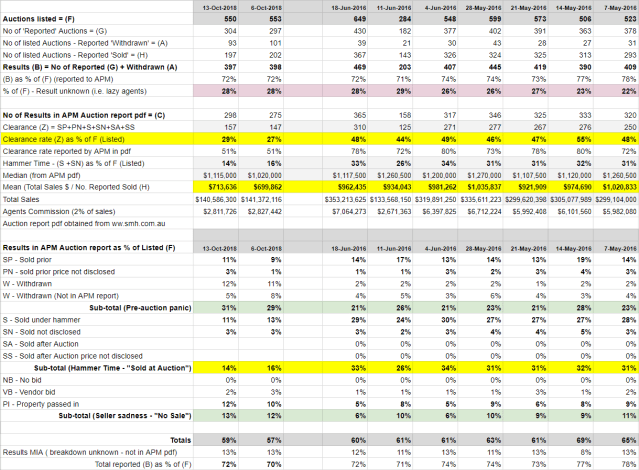
Table 2 – Year on Year comparisons
Table 2 compares this weekend with the same weekend in the last 8 years. Not only was the clearance rate this week the lowest during that period but so was the average sale price of $713,636 (Total Sales divided by total sales). The agents estimated total commission on those sales was also very watery compared to recent years.

Table 3 – Summary
Table 3 is a summary of recent weeks of auction action. Figures from 2016 are included to cheer up folks with memories of the days of endless RBA encouraged and APRA enabled credit driven housing bubbliciousness. Hammer time is a shadow of its former self.
Categories: Macrobusiness

Very good. Looking forward to regular (monthly?) updates on this theme!
LikeLiked by 1 person
🙂
LikeLike